this post was submitted on 24 Aug 2023
173 points (94.4% liked)
World News
32153 readers
774 users here now
News from around the world!
Rules:
-
Please only post links to actual news sources, no tabloid sites, etc
-
No NSFW content
-
No hate speech, bigotry, propaganda, etc
founded 5 years ago
MODERATORS
you are viewing a single comment's thread
view the rest of the comments
view the rest of the comments
anyone know a better radioactivity monitoring site than this one?
https://map.safecast.org/?y=37.527&x=140.969&z=10&l=0&m=2
Fukushima sure is lit up like a Christmas tree on this one.
Radiation levels have decreased since the accident in 2011:
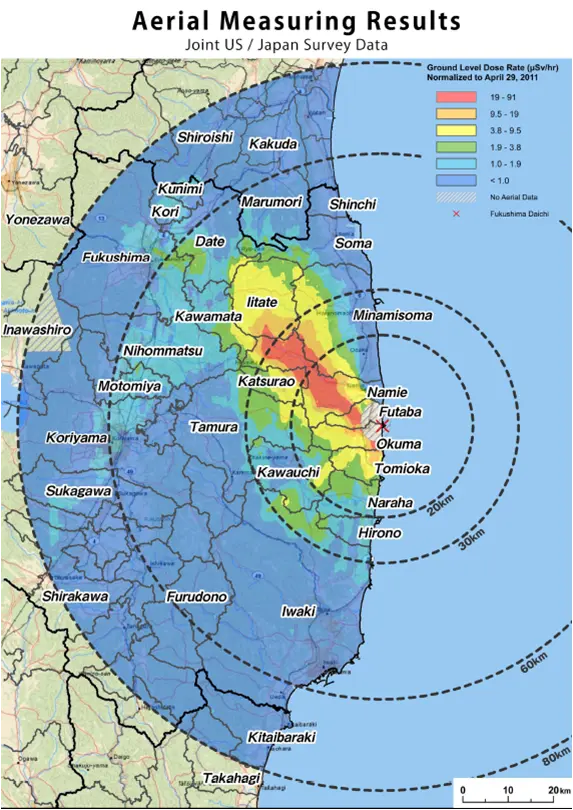
https://upload.wikimedia.org/wikipedia/commons/0/06/Fukushima_radiation_dose_map_2011-04-29.png
Note that on Safecast, you can enable "Crosshair" in the hamburger menu to see the actual numbers.
The central blob area is currently around 5 μSv/hr, so if you live there for a year it's 44000 μSv, or 44 mSv. The xkcd chart says 100 mSv is the lowest one-year dose clearly linked to increased cancer risk.
So 3 years there equals measurable increased cancer risk.
Cancer risk from radiation is not just the absolute amount of exposure, but the duration of the exposure as well. Short high-intensity radiation doses carry higher risk than long, low-intensity doses.
And 100mSv/yr is a rate, which is greater than 44mSv/yr. After 4 years, you will still have not had the dose needed that is linked with increased cancer risk.